
Reports and analytics
Training reports by branch and area
Did they finish? Did they understand? Did they apply it? All three answers by area, branch and person, with Excel export and scheduled email delivery for your operations.
Simón6:00 PM
Your team's summary
12 people finished Closing the register today.
Closing the register
Last 30 days
- enrolled
- 120
- completed
- 98
- completion rate
- 82%
- average score
- 87/100
The short answer
How do you measure training for frontline staff?
With three questions, in this order. Did they finish?: who is active, who has never signed in, who hasn't signed in for 14 days and the completion rate by course and by area. Did they understand?: first-attempt mastery and the most-missed questions. Did they apply it?: the evidence your people upload from the workplace, assessed against a rubric.
In Simón those answers live in your account dashboard, with filters for period, workspace and area; sub-areas, like each branch, are included automatically. Every number comes with its definition and every table downloads to Excel.
Measuring completion alone is misleading: a finished course doesn't tell you whether it was understood. That's why mastery is measured on the first attempt, and a retry doesn't inflate it.
Did they finish?
Progress and completion, from the whole account to each person
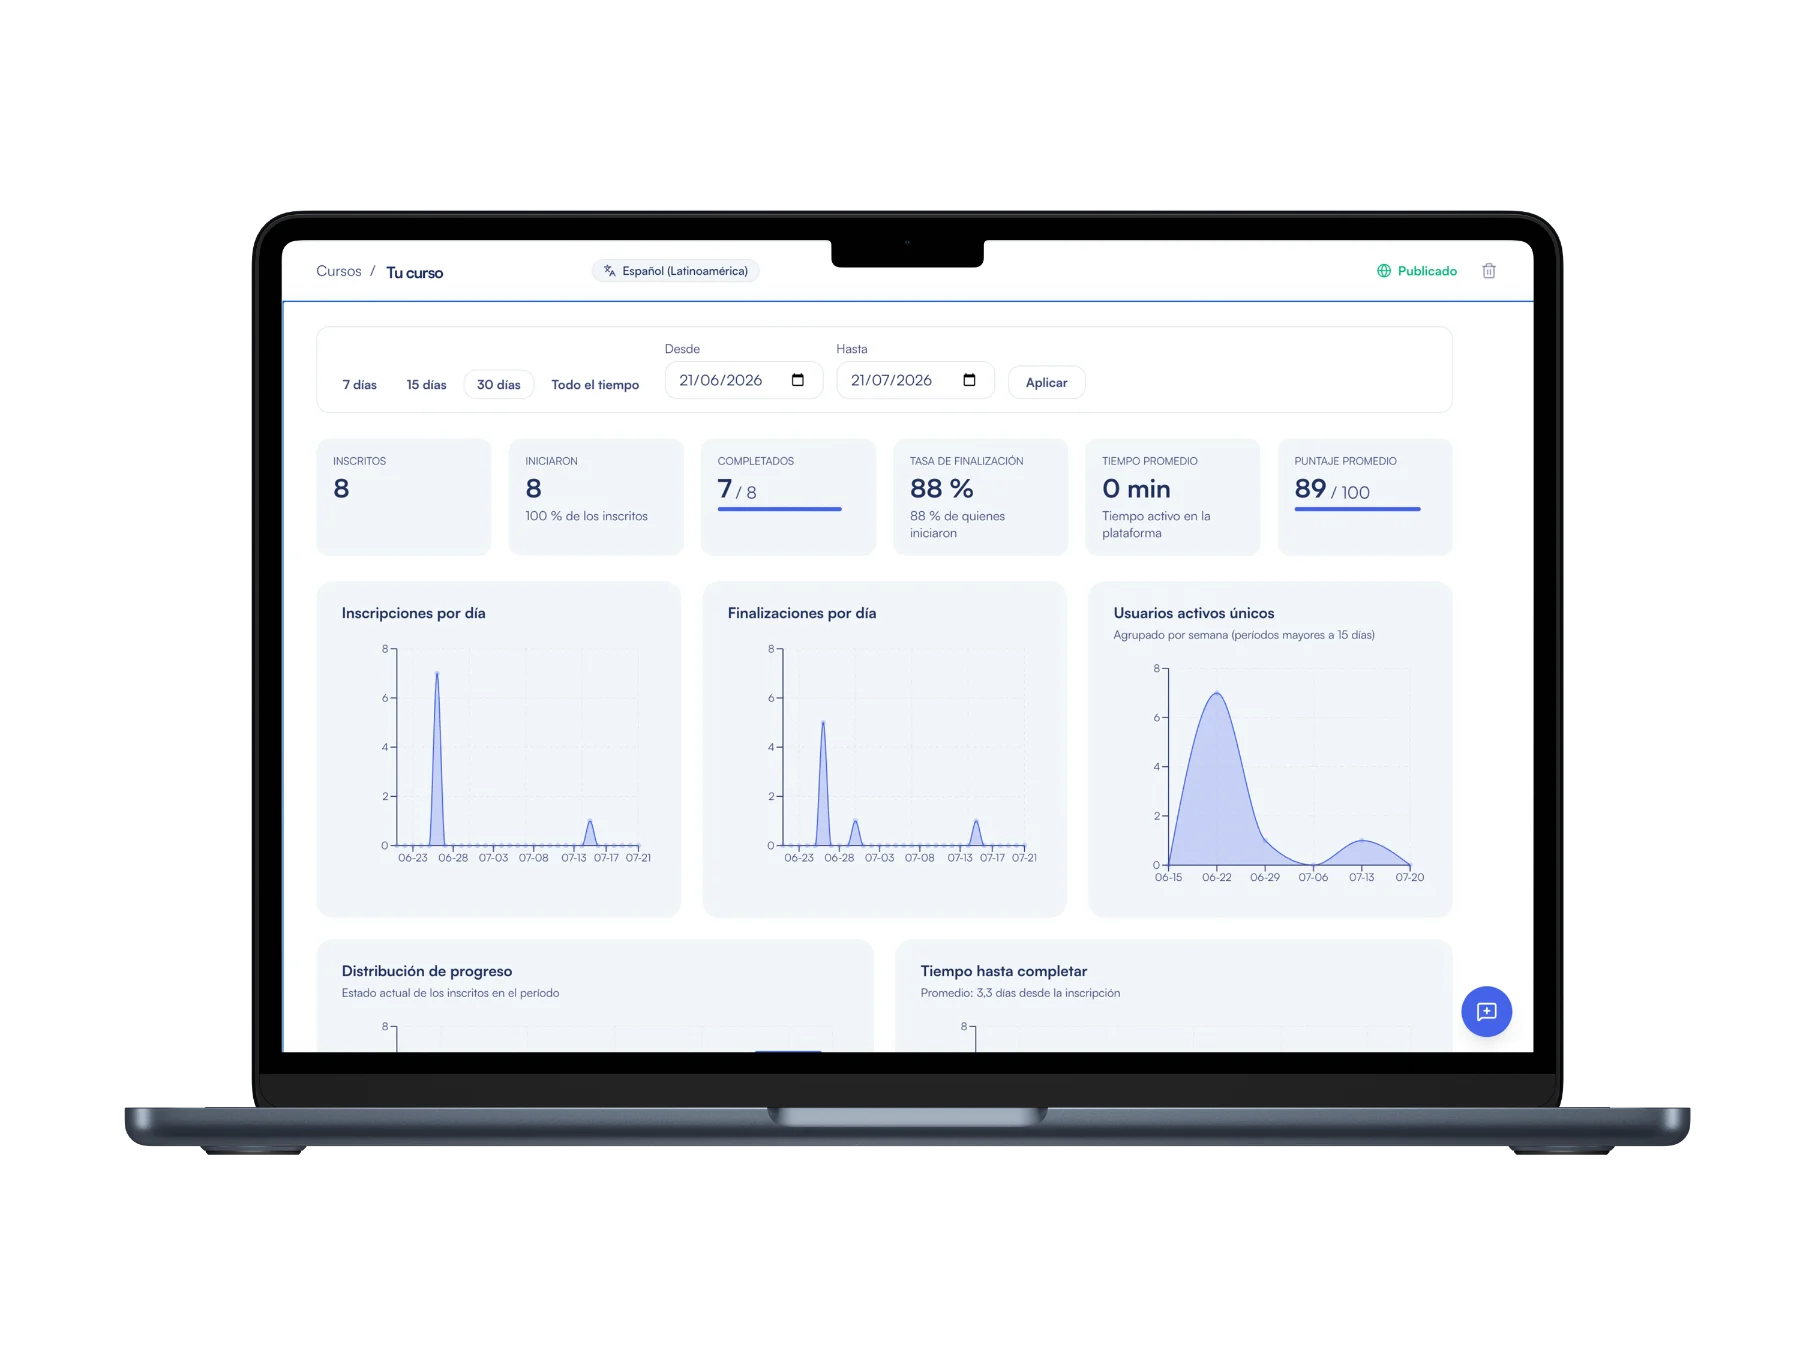
The dashboard counts everyone who currently has published courses for their area, including people who never opened the app, with name, area and pending courses so you can follow up.
Inside each course you see who enrolled, started and completed, the time to complete and the module where people drop off.
- Active, never signed in and at risk (14 days or more without signing in)
- Completion rate overall, by area and by course
- Average time to complete the course
Comprehension by branch
See which branch understood and which one needs reinforcement
First-attempt mastery and the most-missed questions, by area, branch and person, so you reinforce exactly where it's needed.
First-attempt mastery
Closing the register
- Downtown branch23/25
- North branch19/24
- West branchReinforce9/21
Did they understand? Did they apply it?
Comprehension and execution, not just clicks
First-attempt mastery
The share of correct answers on the first attempt at each question, by course, lesson and area, with a traffic light and the sample size in view.
Most-missed questions
The questions with the most errors and how many attempts people need tell you which topic to reinforce before it shows on the floor.
Performance of each piece of content
How many reached and completed each piece, the drop-off curve of videos, the answers to each quiz and exam, and screen time on documents and infographics.
Engagement Score
A 0 to 100 score by course and area that combines how many finish the video, how much they watch, smooth playback and early drop-off. It flags when a drop looks like the network and not the content.
Evidence of application
In activities with a photo or voice note you see how many submitted, the share rated well developed, compliance with each rubric concept and what's awaiting review.
Audit log
Publications, user changes, grading and exports are recorded with who and when, and each person's activity downloads as a CSV file.
Reporting
Build the report you're asked for, without asking anyone
In Reporting you choose the metrics (people, assignments, completed at 100%, % compliance and average time to complete) and how to group them: workspace, area, sub-area, course, age, gender or status. You compare against the previous period or the same period last year, and export exactly what you see to Excel or CSV.
You save the setup as a report for your account or start from one of the seven predefined ones, such as compliance by area. And you schedule it: daily, weekly or monthly, for up to 20 recipients.
Area supervisors
Each supervisor sees their team, and only their team
You assign a supervisor to each area or branch. In My team they see who is active, who has stalled, who has low mastery and which modules lose more people than the company average. They don't see other areas' data, not even in downloads.
Every day at 6:00 p.m., account time, they get a summary of how many people finished each of their team's courses. If they're also a learner, they see their team from the app.
Frequently asked questions about training reports
What should a training report include?
Three things: progress (who finished, who hasn't started and who stalled), comprehension (first-attempt mastery and most-missed questions) and application (evidence from the job), by area, branch and person.
How is the completion rate calculated?
In each course you see completions over enrolled learners and over those who started. In the account view, everyone with published courses for their area counts, including people who never opened the app.
Can I see training compliance by branch?
Yes. Each branch can be an area or sub-area, and in Reporting you group % compliance by workspace, area, sub-area or course. With one supervisor per branch, each one sees only theirs.
Can reports be exported to Excel?
Yes. Dashboard tables download to Excel, a course's performance comes in a single file, and Reporting exports to Excel or CSV or emails the file.
Who can see the data?
The account administrator sees everything; an area supervisor, only their area and its sub-areas. Unless the account enables it, managers see masked emails and phone numbers, in downloads and deliveries too.
How do I know whether they applied what they learned?
With hands-on activities: the person uploads a photo or voice note from the workplace and Simón assesses it against a rubric. The report shows the share rated well developed and which concepts are met.
Keep exploring
Keep exploring the platform
AI courses
Turn your manuals and PDFs into micro-lessons with video, infographics and quizzes.
Access without an app or email
How your people sign in from the phone's browser with a phone number or employee ID and a PIN.
Simón for Operations
A procedure change reaches the floor the same day, with evidence of who saw it.
Simón vs LMS and Moodle
How Simón works alongside your LMS and what it adds on the floor.






Walk through the reports with us
Book 30 minutes and we'll show you the dashboard, Reporting and the supervisor view, broken down by area and branch.
No card · Cancel anytime
Multi-country operation, bulk user onboarding or HR integration? We support you site by site.